

Think California tops the charts for online shopping spend? Not quite. When you look at the average order value by state, the real big spenders are hanging out in flip-flops.
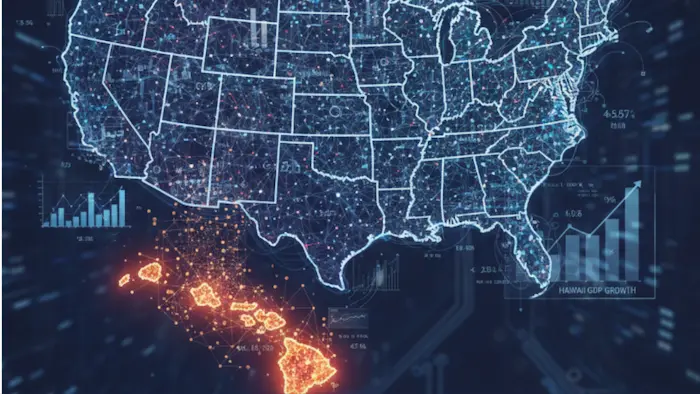
Hawaii leads the pack beating out even high-rollers in California, New York, and Connecticut. According to Adscale’s U.S. data (Mar–Sep 2025), island shoppers drop more cash per order than anyone else in the country.
TL;DR: Which U.S. States Spend the Most Per Order?
Summary: What This Data Reveals (Average Order Value by State)
| State/Region | AOV | Order Share | Opportunity Type |
|---|---|---|---|
| HI | Highest | Low | Premium targeting |
| CA | High | Highest | Scaling & volume |
| TX / FL | Strong | High | Balanced acquisition |
| CT, DC, WY | High | Low | Luxury remarketing |
| MS, KY, AL | Low | Low | Low-priority for paid |
Based on Adscale’s U.S. data (Mar–Sep 2025).
And yet, it ranks near the bottom in terms of total orders. So what does this mean for eCommerce brands?
It means bigger doesn’t always mean better. If your marketing strategy is focused only on high-volume states, you might be overlooking markets where fewer shoppers spend far more.
We analyzed data from across the U.S. to map out:
- 💸 Average Order Value (AOV) by state
- 📦 Order Share (%) – how many purchases each state contributes
- 🔵 Revenue Impact – shown by bubble size in the chart
- 🎨 Regional clustering – to identify geographic trends
Here’s what we found.
The Chart: U.S. States by Average Order Value vs. Order Share
Below is a bubble chart of the average order value by state versus order share and revenue impact.
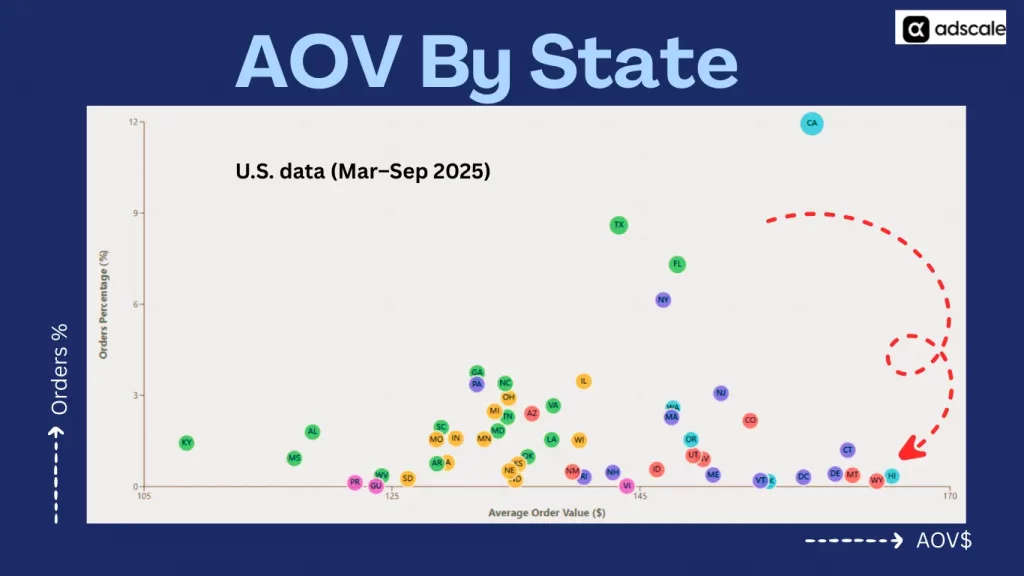
- X-axis = Average Order Value ($)
- Y-axis = % of total orders
- Bubble size = % of total revenue
- Colors = U.S. regions (Pacific, South, Northeast, etc.)
- Label = State abbreviation
Top Insights: It’s Not Just About Order Volume
1. Hawaii (HI) = Highest AOV in the U.S.
- AOV: ~$166
- Order Share: Very low
- Revenue Bubble: Modest
- Takeaway: Hawaii residents spend more per order than anyone else, making them ideal for high-ticket products, luxury brands, or bundled offers.
2. California (CA) = Order Volume + Revenue Powerhouse
- Order Share: ~12% (highest in the country)
- AOV: Solid (~$159)
- Takeaway: California combines massive volume with above-average cart size. It’s your scaling state, ideal for broad campaigns.
3. Texas (TX) & Florida (FL) = High Volume, Strong AOV
- Both states rank high in order share
- AOV is comfortably above national median
- Takeaway: These states are excellent for repeatable, scalable growth, especially for broad-appeal products.
4. Connecticut (CT), Wyoming (WY), DC = High AOV, Low Order Share
- These smaller states have AOVs approaching Hawaii’s
- Order volume is low, but revenue per order is strong
- Takeaway: Perfect for targeted premium campaigns — think gifting, subscription upgrades, or personalized services.
5. Mississippi (MS), Kentucky (KY), Alabama (AL) = Low AOV + Low Order Share
- Bottom-left cluster on the chart
- Lower cart sizes and low transaction counts
- Takeaway: These are low-priority states unless you’re running a low-CAC, high-volume strategy.
How to Use This Data in Your eCommerce Strategy
This chart isn’t just interesting – it’s actionable. By looking at the average order value by state, you can uncover smarter ways to boost revenue, improve ROAS, and scale more efficiently:
✅ 1. Segment Campaigns by Buyer Value
Don’t treat every state the same. Run geo-segmented campaigns like:
- High-AOV states (HI, CT, DC): Push luxury bundles, upsells, and premium products
- High-volume states (CA, TX, FL): Focus on acquisition, cart optimization, and loyalty
- Low-volume/value states: Use for offer testing or long-tail SEO content
✅ 2. Adjust Ad Spend by Geo Performance
If your CAC is rising, look at where your budget is going. Consider:
- Down-bidding in states with low AOV and low conversion
- Increasing spend in high-AOV, underutilized markets like CT or DC
- Retargeting in Texas and California for scale + LTV growth
✅ 3. Personalize Offers by State
Use geo-detected offers in email/SMS:
- “Aloha, Hawaii! Enjoy free shipping on your luxury haul.”
- “Texas shoppers are loving this bundle – grab yours today.”
- “New Yorkers, this deal is just for you.”
Personalization by location can lift CTRs and conversions significantly.
✅ 4. Rethink Product Strategy by Region
Are your higher-priced SKUs converting in high-AOV states? If not, start testing:
- Add price-based filtering by location
- Run region-specific product recommendations
- Use this data in new product development for regional needs
Real Example: How a Skincare Brand Could Use This
Let’s say you sell a line of skincare products, AOV ~$65:
- In Hawaii, you promote your 3-pack bundles or luxury facial kits
- In California, you run a standard full-funnel DTC ad campaign
- In Mississippi, you promote your budget line or samples
Suddenly, your CAC is lower, your AOV is rising, and your retention improves, just by aligning state-level behavior with your marketing plan.
Ready to Unlock State-Level Growth for Your Store?
We help eCommerce brands go beyond channels and creatives – into data-backed geographic segmentation that scales efficiently.
👉 Book a free strategy call to:
- Find your high-AOV regions
- Reduce wasted spend on low-value states
- Geo-target campaigns for better ROAS


 ,
,