





On this page
- Key Takeaways
- How Is Revenue Distributed Across Customers?
- Are Your Highest-Spending Customers Also Your Most Loyal?
- Can You Identify a Valuable Customer From Their First Order?
- How Much Do Your Top Customers Contribute?
- How Should You Use Customer Segments for BFCM?
- How Does AI Help Turn Customer Data Into Ad Audiences?
- Methodology: What Do These Benchmarks Measure?
- Frequently Asked Questions
- Know Who You Want to See Again
- Keep Learning
What AdScale’s customer revenue benchmarks reveal about your biggest buyers, and how to use those insights before Black Friday.
Picture the first morning after Black Friday and Cyber Monday. Your team is reviewing orders, comparing campaigns, and deciding which offer deserves another run. Before you repeat the winning promotion, ask one more question: who actually bought?
AdScale’s customer revenue analysis reports that the top 10% of customers generated 34.4% of revenue in the median store over 12 months. The top 20% generated 50.4%. Here, “top customers” means the buyers with the highest total order value during that period.
Those figures give you a starting point for understanding your own customer base. But the most useful finding is about behavior: some top spenders returned throughout the year, while others reached the group with one substantial order.
You would probably speak to those shoppers differently in person. Your advertising and follow-up should reflect that difference too.
Key Takeaways#
- The top 10% of customers accounted for 34.4% of revenue in the median store in AdScale’s analysis.
- The top 20% contributed 50.4%, showing why the familiar 80/20 rule should be tested against your own data.
- Among top customers, the median repeat-purchase share was 60%. A substantial group reached the top through a single order.
- Separate spending from repeat behavior when planning audiences, offers, and post-purchase messages.
- Apply these annual findings to BFCM planning, then measure holiday customers separately.
How Is Revenue Distributed Across Customers?#
Revenue was concentrated among a relatively small group of buyers, but customers outside that group still contributed substantially. In the median store, the bottom half of customers generated 21.4% of revenue.
| Customer group, ranked by spending | Share of 12-month revenue |
|---|---|
| Top 1% | 8.2% |
| Top 10% | 34.4% |
| Top 20% | 50.4% |
| Bottom 50% | 21.4% |
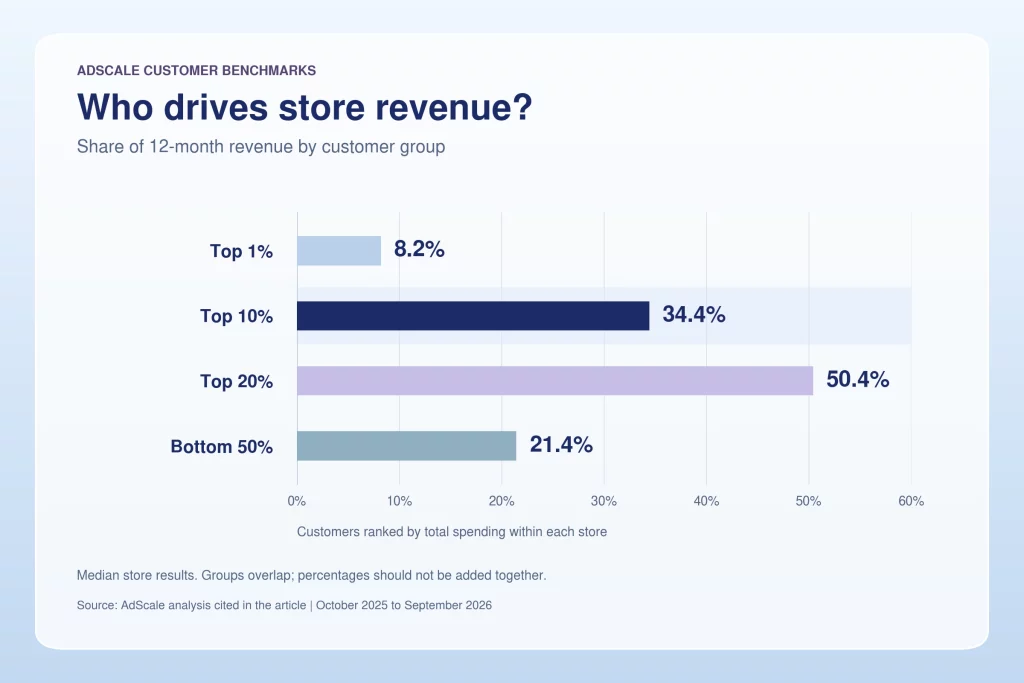
Source: AdScale customer revenue analysis, October 1, 2025, to September 30, 2026. Each value is the median of store-level results. The top groups overlap and must not be added together.
The middle half of stores recorded a top-10% revenue share between 29.2% and 42.9%. Your own figure may sit above or below that range. Use it to investigate your customer mix, rather than as a target to maximize.
A high concentration could reflect repeat buyers with strong relationships to your brand. It could also reflect a few unusually large purchases. Those situations call for different decisions.
Does the 80/20 rule apply to eCommerce customers?#
The 80/20 rule says that 20% of customers generate 80% of revenue. AdScale’s reported median was 50.4%, so the rule did not describe the midpoint of this analysis.
The remaining customers still accounted for roughly half the business. Some may be trying your store for the first time. Others may buy regularly from lower-priced product categories.
Prioritize your top buyers while giving those customers a clear reason to return. Their current spending rank does not tell you their future potential.
How should you compare customer revenue across industries?#
Compare stores with similar products and purchase cycles wherever possible. A beauty shopper replenishing a favorite product behaves differently from a homeware shopper furnishing a room.
For your own analysis, look at category, product pricing, purchase frequency, and promotions alongside revenue concentration. This article’s overall figures describe participating AdScale stores; they are not universal industry averages.
Are Your Highest-Spending Customers Also Your Most Loyal?#
High spending and repeat purchasing measure different things. In AdScale’s analysis, the median share of top customers who bought more than once was 60%. The corresponding one-order share was 40%.
| Behavior during the 12-month period | Top 10% of customers | Remaining customers |
|---|---|---|
| Orders per customer | 2.19 | 1.13 |
| Share who purchased more than once | 60.0% | 11.2% |
Source: AdScale customer revenue analysis. Each figure summarizes the median store result for that measure.
Imagine two shoppers arriving during BFCM. One has bought from you throughout the year and returns for a favorite product. Another discovers your store while buying gifts and fills a large basket.
Both may contribute meaningful revenue. Only the first has demonstrated repeat buying. The gift buyer might become a regular, but that relationship still needs to develop.
Start with two questions: how much has this customer spent, and have they come back? Then check what they bought and how recently. AdScale’s customer segmentation guide shows how to turn those answers into groups with clear rules and useful next actions.
Can You Identify a Valuable Customer From Their First Order?#
A large first order identifies a substantial purchase. It does not establish future loyalty.
AdScale’s analysis found that customers who finished in the top 10% had an initial order within the measured period that was 2.8 times as large as other customers’ initial orders in the median store. However, that order may not have been their first-ever purchase, and its value helped determine their spending rank.
Use a large new-customer order as a reason to follow the relationship closely. To test its connection to future value, measure purchases made after that order. Give each customer the same follow-up window and account for returns.
During BFCM, a large basket might reflect gift buying, a bundle, or a promotion. Track whether those shoppers return after the offer ends before treating them as established VIPs.
How Much Do Your Top Customers Contribute?#
Rank purchasing customers by total order value over a consistent period. Select the highest-spending tenth, then divide their combined order value by the total for all purchasing customers.
Top-10% revenue share = (revenue from the highest-spending 10% of customers ÷ revenue from all customers) × 100
Use these six steps to turn the calculation into a marketing decision:
- Choose your period and revenue definition. Use a full year for an annual comparison. Define how you handle discounts, refunds, taxes, shipping, and cancellations, and keep that treatment consistent.
- Build one record per customer. Export customer IDs and eligible orders, remove duplicate order records, and total spending for each customer. Count buyers in the period, rather than everyone subscribed to your emails.
- Rank and select the top 10%. Sort by total spending and select one-tenth of customers. Apply a consistent rounding rule when the customer count is not divisible by ten, and document how ties are handled.
- Calculate the revenue share. Divide the selected group’s revenue by the total. Compare it with the reported 34.4% median only when the revenue definitions and time windows are sufficiently similar.
- Separate one-time and repeat buyers. Within your top group, identify who bought once and who returned. Review products, discounts, and returns before choosing a follow-up offer.
- Measure what happens next. Follow new-customer groups over equal periods, such as 30, 60, or 90 days. Track repeat purchases and revenue after the initial order, allowing for your category’s normal buying cycle.
The calculation tells you where past revenue came from. The follow-up tells you whether your next action helped.
How Should You Use Customer Segments for BFCM?#
Match each group to a relevant offer and a measurable next step. Spending, purchase frequency, and product preferences provide a practical starting point.
| Customer group | BFCM action to test | Measure afterward |
|---|---|---|
| High-spending repeat buyers | Early access or recommendations based on past purchases | Repeat purchases and contribution after discounts and returns |
| High-spending one-time buyers | Complementary products related to the original purchase | Second-purchase rate and subsequent revenue |
| Lower-spending repeat buyers | Useful bundles or replenishment reminders | Order value, repeat purchases, and contribution |
| New BFCM buyers | Product guidance followed by relevant recommendations | Returns and repeat purchases over an equal follow-up period |
The new-buyer group can overlap with spending groups. Set message priorities so customers do not receive competing offers.
For example, a regular skincare buyer may appreciate a bundle built around products they already use. A gift shopper may need delivery information first and help choosing a complementary product later.
If you are planning bundles, AdScale’s guide to build-your-own versus pre-set bundles explains how shopper needs should influence the format. A larger basket is useful when the offer also makes commercial sense after discounts and returns.
Prepare the follow-up before the promotion begins. Use the post-BFCM customer retention guide to plan how you will review and reach seasonal buyers after the weekend.
These are applications of annual customer findings. Measure the BFCM group separately to learn how holiday buyers behave in your store.
How Does AI Help Turn Customer Data Into Ad Audiences?#
AI segmentation helps keep customer groups aligned with changing behavior. A one-time buyer becomes a repeat customer when they place another order; a useful audience should reflect that change.
AdScale’s AI Audience & Segments uses purchase and behavioral data to create dynamic groups, including high-AOV shoppers and one-time versus loyal customers. These audiences can support acquisition and retargeting campaigns across Google and Meta, as well as email activity.
AdScale’s Standard & Strange case study describes using high-AOV and high-spending segments within its AI advertising strategy. It provides a practical example of how customer value can inform audience selection.
Start with a defined group and an offer that fits its behavior. Use AI to help maintain the audience, then evaluate campaign results against your goal. The benchmark describes past customers; campaign measurement shows whether your approach is working.
Methodology: What Do These Benchmarks Measure?#
AdScale’s analysis covers orders placed between October 1, 2025, and September 30, 2026. Customers were ranked within each participating store by total order value during that period.
Results were calculated per store and summarized using the median, the midpoint of store results. Revenue shares describe the measured year, not lifetime value or profit. The first-order comparison uses the first purchase observed within the period, which may not be the customer’s first-ever purchase.
These descriptive benchmarks apply to participating stores. They do not establish industry-wide averages, future customer behavior, or the effect of a marketing tool. When comparing your results, align the reporting period and revenue definitions.
Frequently Asked Questions#
What percentage of revenue comes from the top 10% of customers?#
AdScale’s customer revenue analysis reports a median share of 34.4% over 12 months. The middle half of participating stores ranged from 29.2% to 42.9%. These figures describe the stores analyzed, rather than a universal eCommerce average. Calculate your own share using the same period and a comparable revenue definition.
What makes a customer high value in eCommerce?#
A high-value customer contributes meaningfully to the business under a defined measure, such as revenue or profit over a specified period. This article ranks customers by annual order value. For marketing decisions, also consider repeat purchases, discounts, returns, and acquisition costs before treating high spending as evidence of profitability.
Is a higher top-customer revenue share better?#
A higher share is not automatically better. It means more revenue comes from a smaller portion of customers. Investigate whether that reflects repeat relationships, occasional large purchases, or dependence on a narrow group. Evaluate the share alongside overall growth, retention, and profitability before deciding whether it needs to change.
Does a large first order mean a customer will buy again?#
A large first order does not prove that a customer will return. It establishes the value of that purchase. To evaluate future behavior, compare subsequent purchases over equal follow-up periods, separate new customers from existing buyers, and account for returns and the influence of promotions on basket size.
How can you identify your best customers before Black Friday?#
Review a consistent period of order history, rank customers by spending, and separate repeat buyers from one-time buyers. Add product preferences and purchase recency to make the groups useful. Prepare relevant offers for each segment, then track repeat purchases and contribution after BFCM to evaluate the results.
Know Who You Want to See Again#
After BFCM, you will know which promotion brought in orders. With the right customer view, you can also see who returned, who made a substantial first purchase, and who needs a reason to buy again.
Start before the rush. Find your top spenders, separate their buying patterns, and choose a relevant next step for each group.
Explore AdScale’s AI Audience & Segments to see how your store data can inform those audiences.
Give your next campaign a clearer picture of the people behind your revenue.
Keep Learning#
- Customer Segments: Definition, 15 eCommerce Examples, and Templates: Define practical audiences from customer behavior.
- Post-BFCM New Customer Retention: Plan what happens after the first seasonal purchase.
- Build-Your-Own vs. Pre-Set Bundles: Match bundle formats to your customers’ needs.


 Shopify
  WooCommerce
  PrestaShop
  Magento
  BigCommerce
  Opencart
  Wix
Wix 




 ,
,