



On this page
- Key Takeaways
- What Do Published Benchmarks Say About Flows Versus Campaigns?
- What Did AdScale’s Data Actually Measure?
- Is This an Email Finding or a Merchandising Finding?
- Can Trending Products Strengthen Lifecycle Emails?
- How Many Products Should a Trending Email Include?
- Will a Weekly Trend Email Cause List Fatigue?
- How to Test a Weekly Trend Email Without Fooling Yourself
- Frequently Asked Questions
- What Should a Growth Lead Do Next?
- Keep Learning
Public benchmarks show that automated flows are far more efficient than campaigns. AdScale’s order data suggests bestseller engagement is associated with stronger repeat purchasing, but it does not prove that a weekly email caused the difference.
A store can run a strong welcome series, cart recovery flow, and post-purchase sequence and still go quiet between customer triggers. That creates a reasonable question: could a recurring bestseller or “what’s trending” email bring customers back sooner?
The honest answer is: possibly, but the available evidence does not prove it yet.
In AdScale’s database, customers whose tracked order journey was associated with a bestseller or trending collection page placed repeat orders at a higher rate than customers without that tracked association. That is a meaningful signal. It is not evidence that a weekly email caused the increase, because the analysis did not randomly assign customers to receive or not receive such an email.
Public email benchmarks establish something different, and much more firmly. Automated lifecycle flows outperform one-off campaigns by a wide margin on revenue efficiency. A weekly trend email is a campaign, so it should not replace welcome, browse abandonment, cart, post-purchase, or win-back automation.
The strongest conclusion supported by the evidence is narrower: current product-demand signals are worth testing in email, especially inside lifecycle flows that already perform well. If a brand also tests a recurring trend campaign, it should measure the incremental effect against a holdout group rather than assume the format works.
Key Takeaways#
- Klaviyo’s 2026 benchmarks show that flows generate nearly 18 times more revenue per recipient than campaigns, so weekly trend emails should not replace lifecycle automation.
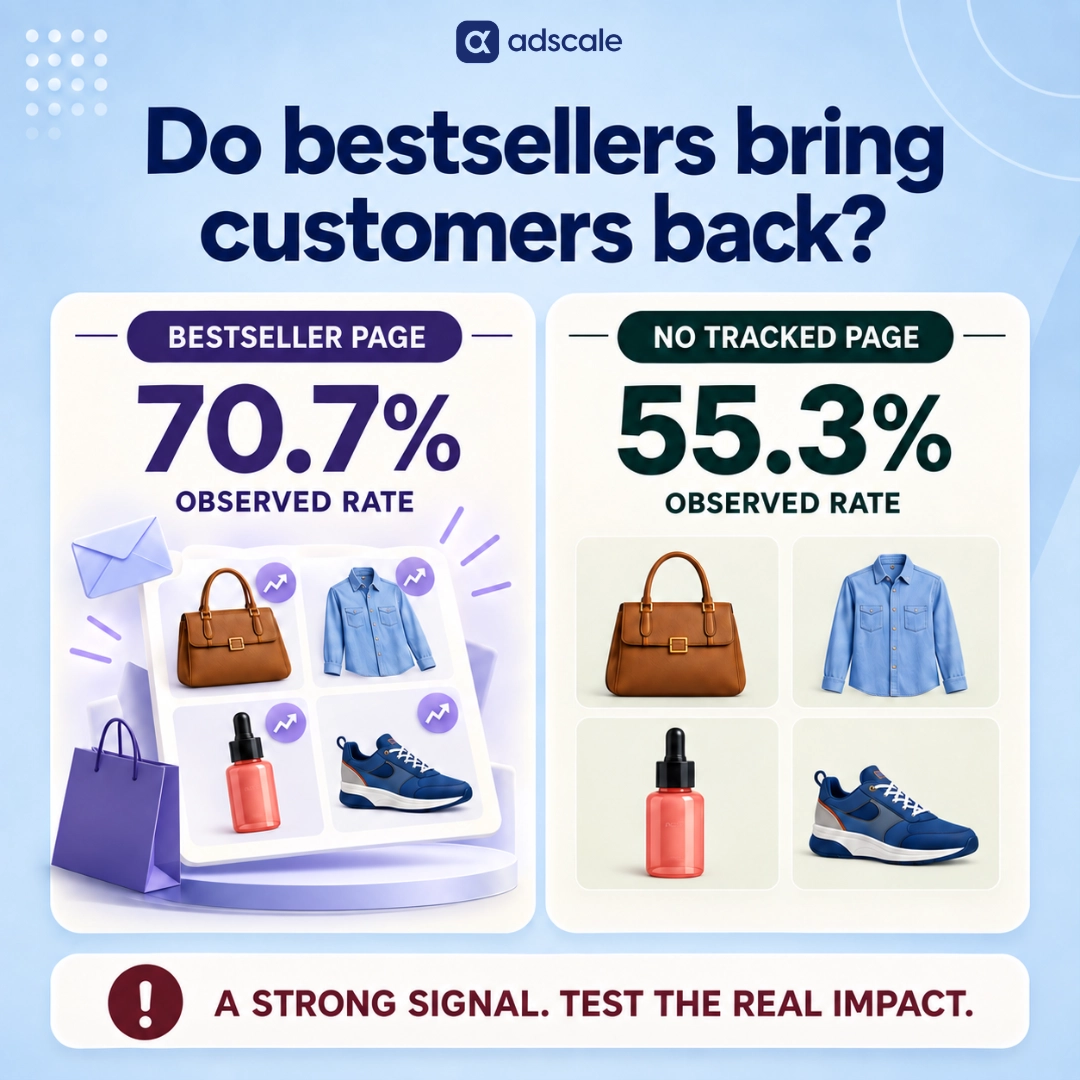
- In AdScale’s observational data, customers associated with bestseller or trending pages had a 70.7% repeat-purchase rate versus 55.3% for the comparison group, a difference of 15.4 percentage points.
- The AdScale result shows correlation, not causation. More engaged customers may be more likely both to browse bestseller pages and to buy again.
- Trending information is a merchandising signal, not an email format. It can be tested in campaigns, flows, ads, and on-site recommendations.
- The right way to evaluate a weekly trend email is with a randomized holdout and revenue, repeat-purchase, and unsubscribe metrics measured over a defined period.
What Do Published Benchmarks Say About Flows Versus Campaigns?#
The public evidence is clear on one point: automated flows are more efficient than scheduled email campaigns.
Klaviyo’s 2026 email benchmarks, based on more than 183,000 customers, report that campaigns account for 94.7% of email volume while flows generate nearly 41% of total email revenue from only 5.3% of sends. Average revenue per recipient is nearly 18 times higher for flows. Flow emails also produce more than three times the click rate and 13 times the placed-order rate of campaigns.
Omnisend’s 2025 eCommerce marketing report, based on roughly 24 billion emails sent in 2024, found a similar pattern. Automated emails generated 37% of email-driven sales from 2% of email volume. Abandoned cart, welcome, and browse abandonment messages produced 87% of automated orders.
These comparisons do not tell us whether a particular weekly trend campaign will succeed. Triggered flows reach customers after a relevant action, while campaigns reach broader audiences on a schedule. The audiences, timing, and intent are different. Comparing their averages does not create a fair head-to-head experiment.
It does tell us what not to do: do not remove effective flows to make room for a newsletter. If trending-product information adds value, it should strengthen the existing lifecycle program or fill a separate campaign role that the flows do not cover.
What Did AdScale’s Data Actually Measure?#
AdScale analyzed approximately 27 million orders across 240 merchants during a trailing 12-month period reviewed in September 2026.
The analysis identified customers whose recorded order-source URL matched common bestseller, top-seller, or trending collection-page patterns, such as /collections/best-sellers or /collections/trending. Approximately 2,300 customers had at least one order associated with one of those tracked URL patterns.
Their behavior was compared with customers in the same order-history dataset who did not have a matching source URL recorded.
The result:
- 70.7% of customers in the tracked bestseller or trending group placed more than one order within the 12-month observation window.
- 55.3% of customers in the comparison group placed more than one order within the same type of window.
- The difference was 15.4 percentage points, or approximately 27.8% higher in relative terms.
- Orders associated with a bestseller or trending page had an average order value of approximately $129, compared with $122 for other tracked-channel orders, a relative difference of about 5.7%.
This is an interesting association, but it has important limits.
First, the analysis is observational. Customers who reach a bestseller page may already be more familiar with the brand, more active on the site, or more motivated to buy. Any of those characteristics could also make them more likely to return.
Second, an order-source URL is not the same as a complete record of every page a customer viewed. The analysis identifies a tracked association with a URL pattern, not definitive exposure to a particular email or merchandising treatment.
Third, the approximately 2,300 identified customers are a small subset of the much larger order database. That may reflect how rarely merchants use consistent collection-page naming and source tracking. It also means the result should be treated as directional until the analysis is repeated with stricter tracking eligibility, category controls, exact group sizes, and statistical confidence intervals.
The data supports a testable hypothesis: customers who engage with current bestseller or trending assortments may be more likely to purchase again. It does not support the claim that sending a weekly trend email will increase repeat revenue by a specific percentage.
Is This an Email Finding or a Merchandising Finding?#
It is primarily a merchandising finding.
In the AdScale data, email accounted for approximately one quarter of orders associated with bestseller or trending pages. Social contributed a similar share. Direct visits, organic search, and on-site browsing accounted for just over half.
That channel mix matters. If most associated orders did not originate from email, the analysis cannot be used as proof of email performance. What it suggests is that visible popularity may help customers navigate a catalog across several touchpoints.
This leads to the most useful reframe in both versions of this article:
Treat “what’s trending” as a data feed, not as a campaign format.
A demand signal can appear in a weekly broadcast, but it can also improve a browse-abandonment flow, a post-purchase cross-sell, a win-back message, an ad, or an on-site collection. The signal and the delivery mechanism should be evaluated separately.
Can Trending Products Strengthen Lifecycle Emails?#
The benchmark data does not measure this combination directly, but it gives brands a logical place to begin testing.
Flows perform well because timing and customer context make them relevant. Trending data can add a second form of context: what other shoppers are buying now.
For example:
- A browse-abandonment flow can show the browsed item alongside two currently popular alternatives from the same category.
- A post-purchase flow can introduce complementary products that are selling quickly, rather than relying on an evergreen recommendation block.
- A win-back flow can show what has become popular since the customer’s previous order.
- A welcome flow can help a new subscriber navigate the catalog through a short, current bestseller list.
These are plausible applications, not proven outcomes. Each should be tested against the brand’s existing flow rather than treated as an automatic improvement.
The distinction is important. A personalized recommendation says, “Based on your behavior, you may like this.” A trending recommendation says, “Based on recent store-wide demand, customers are buying this.” Neither message is universally better. They answer different questions, and a controlled test is the only reliable way to determine which one works for a particular audience.
How Many Products Should a Trending Email Include?#
There is no universal evidence-based number.
A well-known experiment by Sheena Iyengar and Mark Lepper compared consumer behavior around displays offering 24 jam varieties and six varieties. More people stopped at the larger display, but a higher share purchased from the smaller one. The study is often summarized as a 30% purchase rate for the limited-choice display versus 3% for the extensive-choice display. Read the original study.
That experiment supports the general idea that too much choice can reduce action in some contexts. It does not prove that five, seven, or ten products is the ideal number for an eCommerce email.
For an initial test, a short ranked list of five to ten products is a practical starting point because it is easy to scan and compare. But the number should remain a test variable. A store with a narrow catalog may need fewer products, while a marketplace with distinct customer segments may need separate category-specific versions.
Will a Weekly Trend Email Cause List Fatigue?#
No external benchmark can answer that question for an individual brand.
Aggregate unsubscribe rates mix companies with different audiences, acquisition sources, sending histories, segmentation rules, and attribution settings. They are useful for context, but they cannot prove that a weekly cadence is safe for every list.
The correct benchmark is the brand’s own recent campaign performance. Compare the trend campaign with other campaigns sent to a similar audience and measure:
- Unsubscribe rate per delivered email
- Spam-complaint rate
- Revenue per recipient
- Click rate, while recognizing that clicks alone do not prove incremental sales
- Repeat-purchase rate over a defined 30-, 60-, or 90-day window
- Total campaign pressure on each recipient across campaigns and flows
A weekly send should also replace or compete against another campaign in the test calendar. Adding it on top of every existing message makes it impossible to separate the value of the format from the effect of simply sending more email.
How to Test a Weekly Trend Email Without Fooling Yourself#
1. Define “trending” before looking at the results#
Choose a rule that can be repeated, such as units sold during the previous seven days, growth in unit sales compared with the prior seven days, or sell-through rate. Do not manually select products after seeing which story looks best.
2. Separate bestsellers from fast movers#
A bestseller may lead lifetime or monthly sales without gaining momentum now. A trending product should reflect a recent change in demand. Label each list honestly so customers and analysts know what the ranking means.
3. Create a randomized holdout group#
Randomly assign eligible recipients to receive the trend email or remain in a no-send control group. Keep normal lifecycle flows active for both groups. Randomization reduces the engagement bias that affects observational page-visit data.
4. Keep the first test simple#
Use a short ranked product list with images, prices, and one factual proof point where available. Avoid combining the first trend-email test with a new discount, major design change, or different audience. Too many changes make the result difficult to interpret.
5. Measure incremental business results#
Compare revenue per eligible recipient and repeat-purchase rate between the test and control groups. Also monitor unsubscribes and complaints. Report absolute and relative differences, and include the number of recipients and orders in each group.
6. Run the test long enough to match the purchase cycle#
An eight-week test may be sufficient for a frequently purchased category, but it may be too short for furniture, jewelry, or other considered purchases. Choose the evaluation window from the store’s actual time-to-second-order distribution.
7. Test the signal inside an existing flow#
After evaluating the campaign, test a dynamic trending block against the current recommendation block in browse, post-purchase, or win-back automation. This separates the value of the product signal from the value of adding another scheduled send.
Frequently Asked Questions#
AdScale’s observational data found higher repeat purchasing among customers whose tracked order journey was associated with bestseller or trending pages. It does not prove that an email caused the difference. A randomized email test with a holdout group is required to estimate the campaign’s incremental effect.
No evidence reviewed here supports that conclusion. Klaviyo and Omnisend both show that automated flows generate far more revenue relative to their send volume than scheduled campaigns. A trend email should be tested as an additional campaign role or as content inside existing flows, not as their replacement.
Not without testing. Personalized recommendations use an individual’s behavior, while trending recommendations use recent store-wide demand. They provide different kinds of relevance. Brands can compare them directly inside the same flow, or combine them by showing trending products within the customer’s preferred category.
There is no proven universal cadence. Frequency should reflect how quickly the product ranking changes, how often customers normally buy, and how much email the audience already receives. Start with a controlled test that replaces an existing campaign rather than automatically adding more messages.
Use incremental revenue per eligible recipient and repeat-purchase rate over a predefined window. Include the control group, sample sizes, orders, unsubscribes, and complaints. Open rate should not be the deciding metric because privacy features and inbox behavior can make it an unreliable measure of commercial impact.
What Should a Growth Lead Do Next?#
Do not start by promising that a weekly trend email will produce a particular lift. Start with a clean question:
Does showing current product demand generate incremental repeat revenue for this store, from this audience, at this cadence?
Pull recent order data. Define the ranking rule. Select a short list of products. Randomly hold back part of the eligible audience. Send the same treatment consistently for a period that matches the store’s purchase cycle. Then compare revenue, repeat orders, and list-health outcomes.
At the same time, test the same demand signal inside a lifecycle flow. That is where strong public benchmark performance and the bestseller hypothesis meet most naturally.
The evidence does not justify declaring weekly trend emails a proven retention engine. It does justify testing current product demand as a merchandising signal.
That conclusion is less dramatic than a viral percentage. It is also something a serious growth team can act on without pretending the answer is already known.
Keep Learning#
- Does Bestseller Email Marketing Actually Increase Repeat Purchases?: AdScale’s analysis of product concentration and bestseller merchandising.
- Is Email Marketing Dying for Fashion Brands, or Just the Blast Campaign?: Why triggered messages and scheduled campaigns should be evaluated separately.
- When Should You Send a Coffee Brand’s Replenishment Email?: How actual reorder timing can improve lifecycle automation.
- Can Product Tips in Order Confirmation Emails Reduce Ecommerce Returns?: A practical use of the post-purchase period beyond promotion.
- Post-BFCM New Customer Retention: How to evaluate and retain customers acquired during a seasonal spike.


 Shopify
  WooCommerce
  PrestaShop
  Magento
  BigCommerce
  Opencart
  Wix
Wix 



 ,
,