





Yes, within a single order. No, as a catalog-wide strategy. The two are not the same thing, and mixing them up is where most bundling advice falls apart.
Pull up your store’s AOV report and you’ll see one number. What that number hides is which orders are doing the work. In the second quarter of 2026, AdScale pulled every verified order from 77 active apparel shops on Shopify and WooCommerce in its database, all 451,705 of them, and split them by how many items were in the basket. The gap between a one-item order and a three-item order isn’t a rounding error, but the difference between a store that’s surviving and one that’s compounding.
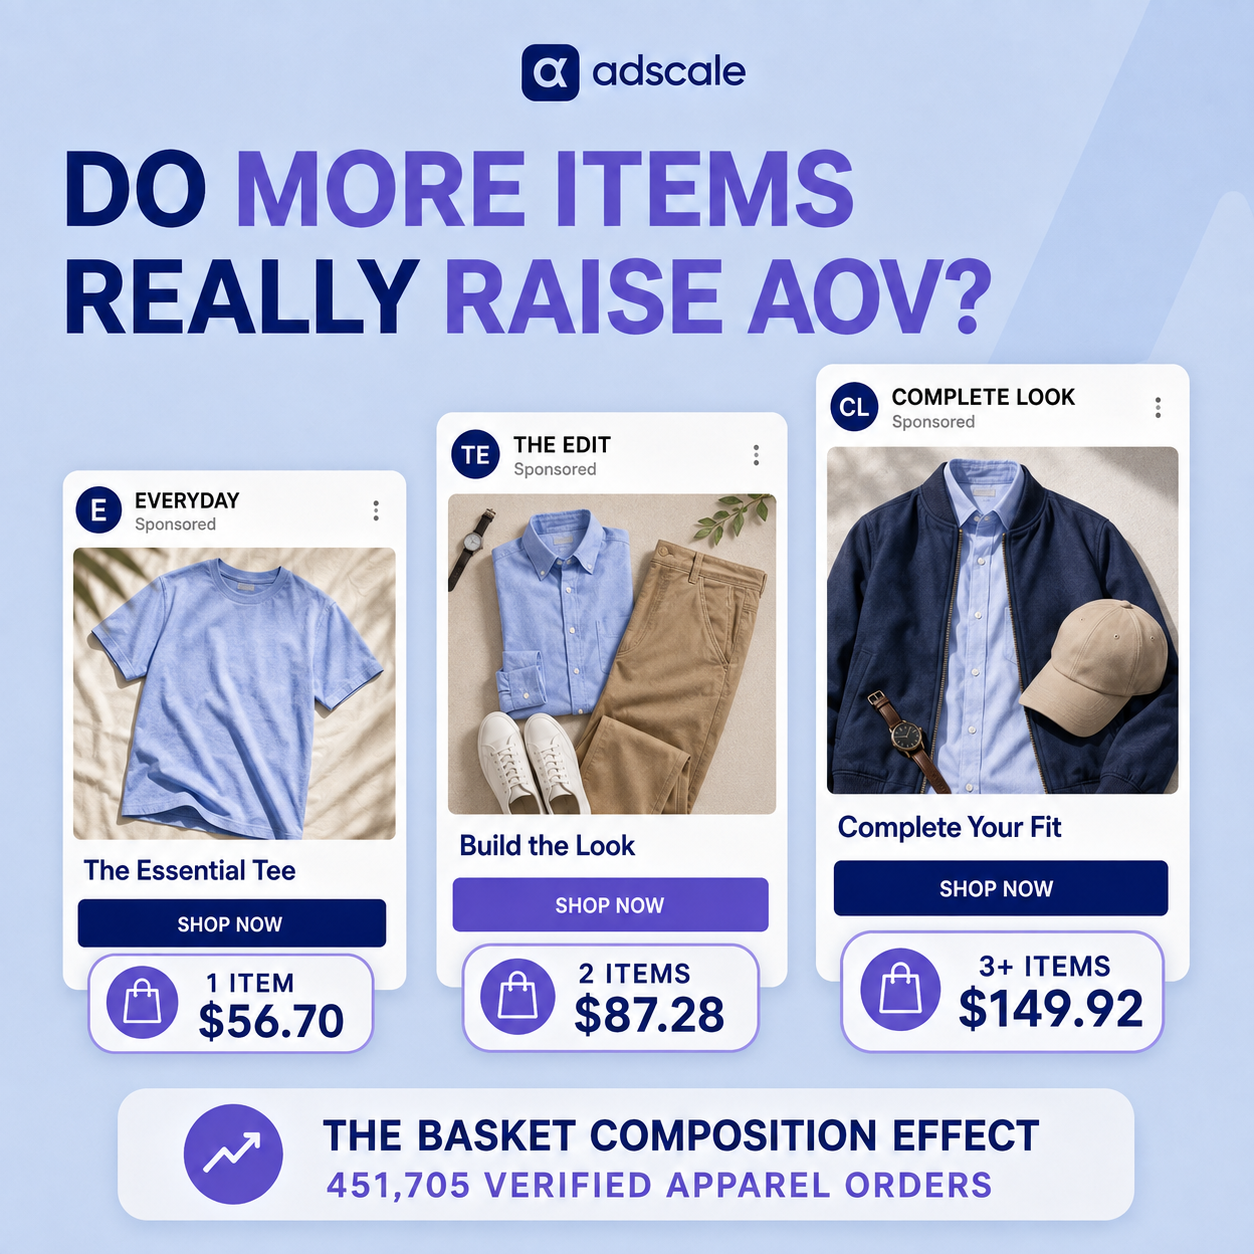
Here’s the direct answer: apparel orders with three or more items carry a median value of $149.92. Two-item orders sit at $87.28. Single-item orders land at $56.70. So yes, items per order and AOV move together, hard. But when AdScale checked whether shops that push more items per order are the same shops posting higher AOV overall, the relationship nearly disappears. That second finding is the one worth sitting with.
Key Takeaways
- Median apparel AOV across 77 verified Shopify and WooCommerce shops in Q2 2026 was $87.77, well above the $60 median across all verticals in the same database.
- Single-item orders carried a median of $56.70. Two-item orders jumped to $87.28. Three-plus-item orders reached $149.92.
- This pattern held steady when the same analysis was re-run against Q1 2026, so it’s not a one-quarter blip.
- At the shop level, though, average items per order barely correlates with average AOV (correlation of -0.18 across 69 shops). Bundling more doesn’t automatically move a store’s headline number.
- The real lever is basket composition at the point of purchase, what this piece calls the Basket Composition Effect, not a blanket “add more upsells” policy across your catalog.
Why Do Merchants Keep Chasing the Wrong AOV Number?
Most merchants treat AOV as a single dial. Raise prices, add an upsell app, and wait for the number to climb. It shows up every quarter across the apparel shops in AdScale’s database: someone reads a benchmark, sees they’re under it, and starts stacking cart-drawer suggestions or discount-triggered bundles without checking whether their own order data supports that move.
The instinct isn’t unreasonable. AOV is one of the few numbers that ties directly to ad efficiency. If your customer acquisition cost is fixed and your AOV climbs, your contribution margin per customer climbs with it, which means you can bid higher in the Meta and Google auctions and still come out ahead. That part of the logic is sound.
Where it breaks down is the assumption that every apparel store’s path to a higher AOV looks the same. A denim brand selling $140 jackets and a basics brand selling $18 tees are not going to hit $85 the same way, and treating “add more items to the cart” as a universal fix ignores what a store is actually selling and to whom. The same trap shows up in other apparel cuts of this database: UK clothing shoppers spend over 50% more per order than US shoppers, and German apparel orders run higher on desktop than mobile. Neither gap closes by copying a tactic across markets. It closes by understanding what’s actually different about the shopper on the other end.
What’s a Realistic Average Order Value for Apparel Stores in 2026?
AdScale looked at every apparel order in its database for Q2 2026 (April 1 through June 30), filtered to active Shopify and WooCommerce shops with real order volume, and excluded zero-item and clearly incomplete order records.
The headline numbers:
- 77 shops, 451,705 orders
- Median AOV: $87.77 (versus a $60 median across every vertical in the database for the same period)
- 38.5% of orders contained a single item, with a median value of $56.70
- 27.6% of orders contained two items, with a median value of $87.28
- 33.9% of orders contained three or more items, with a median value of $149.92
This was checked against Q1 2026 before trusting it. Single-item orders that quarter came in at $59.64, two-item at $92.73, three-plus at $149.55. Close enough across two separate quarters to be confident this isn’t seasonal noise.
Then came the harder question: is this an order-level pattern or a shop-level strategy? Orders were grouped by shop, each shop’s items-per-order and AOV were averaged, and a correlation was run across the 69 shops with enough volume to be reliable. The result was -0.18. Practically no relationship. A handful of the highest-AOV shops in AdScale’s database run lower average items per order than shops sitting well below the median, because their price point does the work instead.
Is Bundling a Catalog Strategy, or Just a Basket Decision?
Here’s where the popular version of this story oversimplifies things. It’s tempting to say “bundle more and your AOV goes up,” and package that as a universal rule. The data says something more specific, worth naming so it’s easy to reach for later: call it the Basket Composition Effect. Within any given shop, a customer who leaves with two items instead of one is worth more, consistently, order after order. But that effect lives inside a single checkout. It doesn’t scale up into a shop-wide law, because the shops with the highest AOV in AdScale’s database aren’t winning by stacking items. Some are winning on price point alone.
The Basket Composition Effect explains why a cart-drawer suggestion can lift AOV for one shop and do nothing for another selling the same category. It’s a property of a specific basket at a specific moment, not a lever every catalog responds to the same way.
So the useful question isn’t “how do I get my catalog-wide AOV to $85.” It’s “where in my own order data is the single-item-to-two-item gap, and what’s stopping that customer from adding a second thing.” That’s a checkout and merchandising question specific to your store, not a benchmark you copy from someone else’s blog post.
How Do You Apply the Basket Composition Effect to Your Own Store?
Start with your own segmentation before you touch your cart drawer. Split your last full quarter of orders by item count the same way this piece did, and look at where your biggest gap sits. For some shops it’s single-item to two-item. For others, the real opportunity is getting two-item shoppers to a third item, since the data shows that jump ($87.28 to $149.92) is actually larger than the first one ($56.70 to $87.28).
Once you know where your gap lives, the fix is narrower than “add an upsell app.” If most of your single-item orders are a hero product with no obvious pairing, a generic “customers also bought” widget won’t move much. If your single-item orders are already close to a natural pair (a top with no bottom, a dress with no accessory), that’s where a cart-drawer suggestion has something real to work with.
This also feeds back into ad targeting, which is where the AOV conversation usually starts in the first place. If you know your two-item basket is worth 54% more than your one-item basket, that’s a number you can use to justify a slightly higher bid on audiences that historically convert into multi-item purchases, rather than optimizing every campaign toward raw purchase volume regardless of basket size. It’s the same logic behind diagnosing weak ROAS before blaming the platform: the number on the dashboard is downstream of decisions made earlier in the funnel, not a knob you turn directly.
One thing worth flagging directly: a bigger basket isn’t free money. AdScale checked its own database on this and apparel refund rates climb with item count too, from 6.6% on single-item orders up to 10.2% on orders with four or more items. That’s real, and it’s a large enough gap to eat into the margin story if you ignore it. But it’s not a reason to sit on your hands. It’s a reason to pair basket-building with the fit and sizing fixes that actually reduce those returns, so the second item you add is one the customer keeps.
Practical Steps
- Pull your last full quarter of order data and split it by item count. Don’t estimate this. Export orders, count line items per order, and get the actual median AOV for one-item, two-item, and three-plus-item baskets.
- Find your biggest gap, not just your lowest bucket. The data shows the jump from two items to three can be larger than the jump from one to two. Check both before deciding where to focus.
- Look at what’s actually missing from your single-item orders. Pull ten recent single-item orders and ask what a customer buying that exact product would realistically want next. Generic bundling logic misses this; your own product catalog knowledge doesn’t.
- Test one complementary pairing at a time. Add a specific suggested pairing to product pages or cart drawers for your highest-volume single-item product, then measure whether basket size for that product actually changes before rolling it out store-wide.
- Track items-per-order as its own KPI, next to AOV, not folded into it. A rising AOV from a price increase looks the same on a dashboard as a rising AOV from more items per order. They call for completely different actions.
- Feed your basket data into campaign structure. If certain audiences consistently produce multi-item orders, that’s worth knowing before you set bid strategy, not after.
- Re-run this analysis every quarter. This finding held from Q1 to Q2 2026, but retail patterns shift with seasonality and promotions. Treat this as a recurring check, not a one-time report.
Frequently Asked Questions
In AdScale’s database, the median apparel AOV for Q2 2026 was $87.77, well above the $60 median across all verticals. Treat this as a directional benchmark, not a universal target. Your own store’s price point and category will shift where a realistic number sits.
Within a single store, yes. The data shows a clear step up from single-item to two-item to three-plus-item orders. But across shops, having a strategy built around more items per order doesn’t reliably predict a higher AOV. It’s an order-level pattern, not a shop-wide guarantee.
There’s no fixed target, but the gap in the data is informative: single-item orders median $56.70, two-item orders $87.28, and three-plus $149.92. This is the Basket Composition Effect at work. The size of each jump tells you where the opportunity sits for a given store, not a universal item count to aim for.
Not automatically, but they’re related. Some of the highest-AOV shops in AdScale’s database aren’t selling more items per order, they’re selling at a higher price point. Price and item count both contribute, and one doesn’t substitute cleanly for the other.
Quarterly, at minimum. This pattern was verified from Q1 to Q2 2026, but retail behavior shifts with seasonality, promotions, and channel mix, so a benchmark that was accurate two quarters ago may already be stale. Treat the Basket Composition Effect as something to re-measure on your own store’s data each quarter, not a fact to file away permanently.
Keep Learning
- Why Are Fashion eCommerce Return Rates So High for Multi-Item Orders?: the returns side of the same multi-item pattern, and why bracket buying inflates the refund rate on bigger baskets.
- Why Do UK Clothing Shoppers Spend Over 50% More Per Order Than US Shoppers?: a market-level look at why AOV benchmarks shift by geography, not just by item count.
- Why Do German Apparel Shoppers Spend More on Desktop Than Mobile?: the device-level version of the same “don’t copy the average” argument made here.

 Shopify
  WooCommerce
  PrestaShop
  Magento
  BigCommerce
  Opencart
  Wix
Wix 






 ,
,