




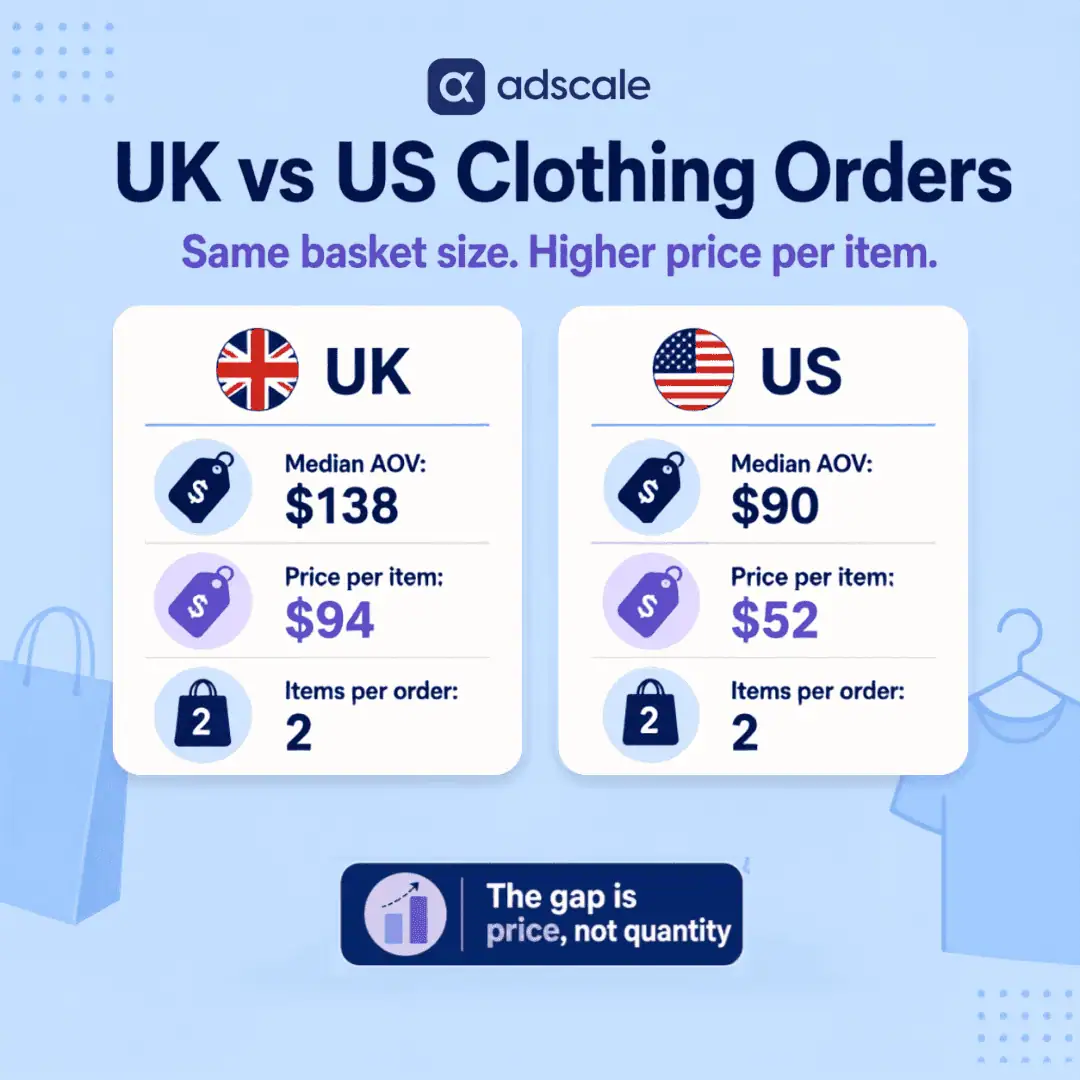


In a recent 90-day window, the median clothing order from a UK store was about $138. From a US store, it was about $90. That is a gap of more than 50%, and it is not because UK shoppers put more in their carts.
Average Order Value gets treated as a proxy for how expensive a brand is. Look across the two biggest western clothing markets, though, and a stranger picture shows up. In a recent 90-day window, AdScale’s data has the median UK clothing order near $138 and the median US order near $90. Same language, same seasons, same broad product category. More than a 50% difference in what lands in the cart.
The obvious explanation, that UK shoppers must be piling more into each order, does not hold. Both markets buy the same number of items per order. The whole gap lives in one place: what each item costs. That is a more useful thing to know than “the UK spends more,” because it points at a completely different growth lever.
Key Takeaways
- In a recent 90-day window, the median UK clothing order (~$138) ran more than 50% higher than the median US order (~$90) across AdScale merchants.
- The gap is driven by price per item, not quantity. UK shoppers paid a median of ~$94 per item versus ~$52 in the US.
- Both markets buy the same number of items per order (a median of 2), so basket size does not explain the difference.
- This is a current-window pattern, not a permanent law. The size of the gap moves over time, so treat it as a “right now” signal and re-check it.
- For advertisers, the payoff is a higher revenue-per-conversion ceiling in the UK, which lifts the ROAS you can achieve, as long as the current price spread holds.
Why “Bigger Baskets” Is the Wrong Answer
Ask most growth marketers why one market outspends another per order and you will hear the same answer: bigger baskets. More items. Bundling. The mental model is that a higher AOV means the shopper added more things before checking out.
It is a reasonable guess. It is also not what the data shows, and it is the kind of assumption that quietly wrecks a media plan. If you build a UK expansion strategy around “get more items into the cart” when the real driver is something else, you optimize for a behavior that is not there and wonder why the numbers do not move.
We ran into this directly while pulling regional benchmarks. The instinct was to explain the UK’s higher order value through cart density. The database did not cooperate. So we followed the data instead of the story.
UK vs US Clothing AOV: What the 90-Day Data Shows
Here is the breakdown from AdScale transaction data in the Clothing vertical, over a recent 90-day window, with outliers above $5,000 and sub-$5 noise removed to strip out wholesale and junk rows.
United Kingdom: ~$138 median AOV, ~$94 median price per item, median 2 items per order (~314,000 orders).
United States: ~$90 median AOV, ~$52 median price per item, median 2 items per order (~267,000 orders).
Read those two lines slowly. The item count is identical. Both markets check out with a median of two items. The difference is entirely in the price of those items: about $94 each in the UK against about $52 in the US. The UK shopper is not buying more. The UK shopper is buying pricier.
This is not a bundling story. It is a price-point story. Two clothing markets, the same basket size, nearly double the price tag per garment on one side.
One honest caveat, because the number deserves it. The exact size of this gap is not fixed. Pull a different window and it widens or narrows, and in some earlier periods the US median has actually sat above the UK. So this is a snapshot of current behavior, not a structural constant of the two markets. That matters for how you use it.
Why the Gap Is Price Per Item, Not Basket Size
The useful mental shift is this: in the current UK clothing market, Average Order Value is behaving as a price-per-item signal, not a basket-density signal. Those are two different levers, and they call for two different playbooks.
If AOV were high because carts were fuller, the growth lever would be breadth: cross-sells, bundles, “complete the look” modules, free-shipping thresholds that nudge a second item in. But the baskets are not fuller. They are the same size on both sides of the Atlantic. The UK order value is high because each item is expensive. Pushing bundles at that behavior fights the current instead of riding it. The lever that matches this market is presenting a higher-priced item well, not padding the cart.
Call it the difference between a volume market and a value market. Both markets happen to buy two items right now, but the US does it at a lower price per piece and the UK at a higher one. Same basket, different price physics.
Is the UK a Better Market for Clothing Ads?
For a brand weighing where to put cross-border spend, the value-market read on the UK is genuinely attractive, with a condition attached.
The pattern is not just a category average; it shows up sharply at the individual merchant level too. One UK womenswear brand on the AdScale platform, with well over 100,000 orders in the window, runs a median order value around $167 at roughly $126 per item. That is the value market in concentrated form: not fuller carts, just higher-priced pieces. A brand with that profile does not need a bundle strategy. It needs every reason for a shopper to feel confident paying $126 for a garment.
That is the practical consequence of the mechanism. A higher AOV per conversion gives you more margin to absorb customer acquisition cost. If each converted UK order is worth ~$138 at the median against ~$90 in the US, your return-on-ad-spend ceiling is structurally higher in the UK per conversion, because each conversion carries more revenue. That is real, and it is the strongest argument for a UK push. For a wider view of how order value feeds into ad returns, our breakdown of clothing industry ad benchmarks across Google and Meta puts the blended all-market clothing AOV near $109, a useful reminder that any single split like UK-versus-US sits inside a bigger picture.
But the mechanism changes the creative and landing-page job. In a value market, you are not talking someone into a bigger basket. You are justifying a higher-priced item: quality signals, material detail, fit confidence, returns reassurance, the reasons a shopper feels good paying $94 for one piece instead of $52. Your ad creative and product pages should sell the item, not the bundle. That creative-first emphasis lines up with where Meta is already heading; our guide to the Meta Andromeda creative strategy covers why the strength of the creative now drives delivery more than the targeting does.
And because this is a current-window pattern, treat it as a position you re-check, not a bet you set and forget. The gap was a different size in earlier periods. It can shift again.
How to Adjust Your UK Ad Strategy
- Verify the pattern for your own catalog before you reallocate. Our benchmark is a category median across many merchants. Your price points may sit above or below it. Pull your own UK-versus-US median AOV and median price-per-item for the last 90 days and confirm the same shape holds before moving budget.
- Match the creative to the price physics. For UK clothing spend right now, build ads and landing pages that justify a higher-priced item: quality, craftsmanship, fit, easy returns. Bundles and “complete the look” prompts will do less work here than the raw AOV might suggest, because the extra value is in price, not quantity.
- Set free-shipping thresholds to the real order, not the assumed one. If the UK median order sits around $138, a $150 free-shipping tier lands just above where most orders already are, a gentle nudge rather than a stretch. Base it on the real order value, not an imagined larger basket.
- Price the CAC against the value market, not the volume one. Because UK conversions carry more revenue at the median, you can tolerate a higher cost per acquisition there and still clear your ROAS target. Model your UK CAC ceiling off the ~$138 order, not the US ~$90 one. If your returns are lagging despite the headroom, our guide to diagnosing and fixing a low ROAS walks through the usual culprits, from targeting to landing-page experience.
- Re-pull the benchmark quarterly. This is a moving signal. The gap changes size across windows and has reversed in earlier periods. Put a recurring reminder to re-run the query so your strategy tracks the market instead of a stale snapshot.
Frequently Asked Questions
Right now the UK offers a higher revenue-per-conversion ceiling, which helps ROAS. But “better” depends on your traffic costs and margins in each market. The higher UK order value gives you more room to absorb acquisition cost. It does not guarantee cheaper clicks or higher conversion rates.
The data shows the difference clearly but does not by itself prove the cause. Contributing factors likely include VAT baked into displayed prices, different product mix, and different shopping habits. What the data does establish is that price per item, not basket size, is where the order-value gap lives.
Not stop, reprioritize. Both markets already buy about two items per order, so cross-sell prompts are not the main lever behind the UK’s higher value. Focus first on justifying the higher-priced item, then test cross-sell as a secondary lever.
Ninety days is a solid read on current behavior and smooths out weekly noise, but it is a snapshot, not a permanent law. The gap changes size across windows and has reversed in earlier periods, so use this as a “right now” signal and re-check it each quarter.
Because the UK’s two items cost far more each: a median near $94 per item versus about $52 in the US. Same quantity, higher price tag. The order-value gap is a price story, not a quantity story.
The One Number That Actually Matters
The number that matters is not the order value on the surface. It is the price per item underneath it. UK and US clothing shoppers are filling carts the same way, two items at a time. The UK shopper is simply paying nearly double for each piece.
Get that backwards and you optimize for a bigger basket that is not coming. Get it right and you match your creative, your shipping thresholds, and your CAC ceiling to how the market actually shops. The only way to know which market you are standing in is to read the data instead of the assumption. The baskets are identical. The price tags are not.
Related Reading
- Clothing Industry Ad Benchmarks: Google vs. Meta: CPA, CPC, conversion rate, and ROAS benchmarks drawn from over 100 million clothing orders.
- Why Your ROAS Is Low and How to Fix It: the common causes of poor ad performance and how to diagnose them.
- Meta Andromeda Update: New Creative Strategy: why creative diversity now drives delivery, and how to build for it.
- Expected ROAS Across Top Ecommerce Channels: how returns compare across Google Shopping, Search, and Meta.

 Shopify
  WooCommerce
  PrestaShop
  Magento
  BigCommerce
  Opencart
  Wix
Wix 








 ,
,