






On this page
An analysis of 2,790,000 US eCommerce orders, January – May 2026, by day of week, hour of day, and device.
The Story Behind the Data #
We analyzed 2,790,000 US eCommerce orders that ran through AdScale between January 1 and May 25, 2026. By looking at this specific window of time, we were able to see the patterns in how people shop, tracking which days of the week they are most active, the exact hours (in EST) they tend to buy, and whether they prefer using a phone or a computer to check out.
One day pulls more than its share. Another lags.#
Order volume varies meaningfully across the seven days of the week. Friday is the highest-volume day in the dataset, followed closely by Thursday and Saturday. Tuesday is the lowest-volume day, lower than Sunday and lower than every other weekday.
The end-of-week concentration is consistent with discretionary purchasing patterns: consumers transact more heavily Thursday through Saturday than they do Monday through Wednesday. The early-week dip is most pronounced on Tuesday, which sits a meaningful step below every other day of the week.

The shopping day has a rhythm and it’s not where most people assume#
The hourly pattern is consistent across all seven days of the week. The intensity of the peak is what varies between days, but the shape repeats. Order volume breaks down into four natural windows:
Overnight (9 PM – 4 AM ET) – quietest period of the day. Volume bottoms out between 2 AM and 5 AM. The 5 AM hour is the single quietest hour of the week.
Morning ramp (8 AM – 10 AM ET) – sharp increase. Order volume nearly triples between 7 AM and 10 AM as the buying day begins.
Peak band (11 AM – 4 PM ET) – the highest-volume window. Roughly 135,000 orders per hour on average across the week. This six-hour band accounts for a disproportionate share of daily order volume.
Evening decline (5 PM – 8 PM ET) – gradual taper. Volume remains elevated but declines steadily through the dinner hours. After 8 PM, the curve drops more sharply.
The early afternoon, not the evening, is the highest-volume window for US consumer purchasing in 2026.

Zoom in: the peak of the peak #
Across all 168 hours of the week, the highest order volume occurs on Saturday, 2 PM Eastern Time, with 28,949 orders in our sample.
The five busiest hours in the week are all concentrated between Friday at noon and Saturday afternoon – specifically Friday 1 PM ET, Friday 2 PM ET, Saturday 12 PM ET, Saturday 2 PM ET, and Saturday 3 PM ET.
For comparison, Saturday 2 PM ET generates roughly 2.5 times the orders of Saturday 9 PM ET, and approximately 7 times the orders of Saturday 5 AM ET (the quietest hour of the weekend). The gap between peak and off-peak hours is large in both absolute and relative terms.
Desktop and mobile aren’t running on the same clock#
Mobile and desktop produce different shopping patterns in our 2026 data.
Volume. Of the 2.25 million orders with identified device data, mobile accounts for 63% and desktop accounts for 37%.
Order value. Median order value is $90 on mobile and $82 on desktop, meaning the typical purchase is now slightly larger on mobile. But the picture inverts at the top of the value distribution: the 90th percentile order on desktop is $287, compared to $252 on mobile. Desktop still captures the largest individual purchases, but no longer dominates the average.
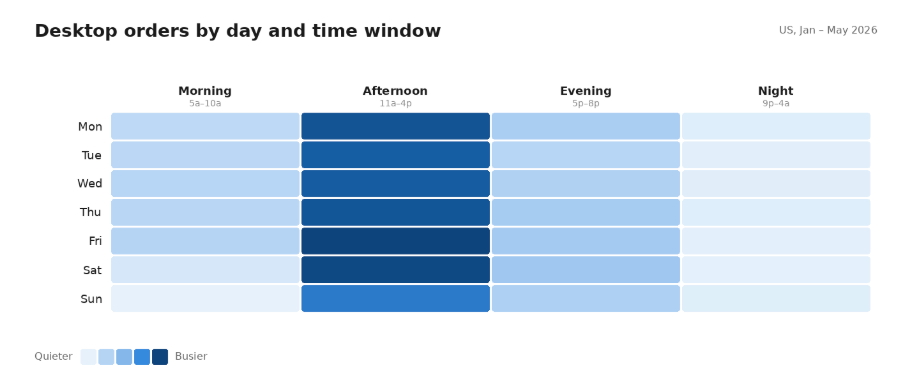
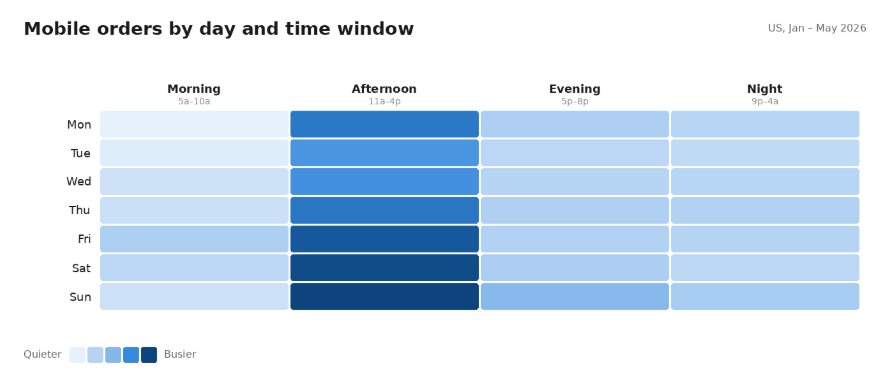
Daily pattern. The two devices peak on different days. Desktop order volume is highest on Friday and lowest on Sunday, a pattern that tracks workweek usage. Mobile order volume is highest on Sunday, with Saturday close behind, and lowest on Tuesday, a pattern that reflects personal-time use rather than work-time use. Both devices show Tuesday as their weakest weekday.
Hourly pattern. Desktop ordering tracks the workday very closely: low overnight, ramps sharply through the morning, peaks in the early afternoon, and drops sharply after 5 PM ET. By the late evening, desktop order volume has fallen by more than half from its afternoon peak.
Mobile ordering is more evenly distributed. Mobile also ramps in the late morning, but its peak window is much wider, order volume stays high from late morning through the evening. Mobile does not collapse after dinner the way desktop does. It also recovers earlier in the morning and remains elevated later into the night.
The practical interpretation: desktop eCommerce is a midday-weekday channel; mobile eCommerce is an all-day, all-week channel that skews toward evenings and weekends.
Why the workday became the shopping day#
The patterns in this dataset are consistent with structural changes in how Americans spend their time. The dominance of weekday afternoon ordering aligns with the spread of hybrid and remote work, which has reduced the separation between work hours and personal hours for a meaningful share of US consumers. The weekend afternoon peak – strongest on Saturday – suggests purchasing has shifted into the post-errand, post-lunch window when households are most likely to make discretionary decisions together.
EMARKETER, whose research partnership with AdScale provides external validation of these findings, comments:
“The findings around mobile commerce growth and evolving purchasing behaviors align with broader ecommerce and omnichannel trends EMARKETER has been tracking across the industry. As consumers increasingly shop across devices and throughout the day, datasets like AdScale’s can help provide additional visibility into how lower-funnel ecommerce behaviors continue to evolve,” says Madel Beaudouin, Director of Data Partnerships at EMARKETER.
Methodology: Order data from US eCommerce stores running ads through AdScale, January 1 – May 25, 2026. Sample of 2,791,725 orders across hundreds of US-based eCommerce stores. All timestamps converted to Eastern Time (UTC-5 standard). Device-level analysis uses the 2.25 million orders with identified device data (mobile or desktop); orders with unknown device tracking and tablet orders are reported separately and not included in the device split.
About AdScale: AdScale is an AI-powered advertising platform serving Shopify and WooCommerce eCommerce merchants worldwide. Our data is featured in EMARKETER’s Industry KPIs.


 Shopify
  WooCommerce
  PrestaShop
  Magento
  BigCommerce
  Opencart
  Wix
Wix 








 ,
,