

AdScale Product Features
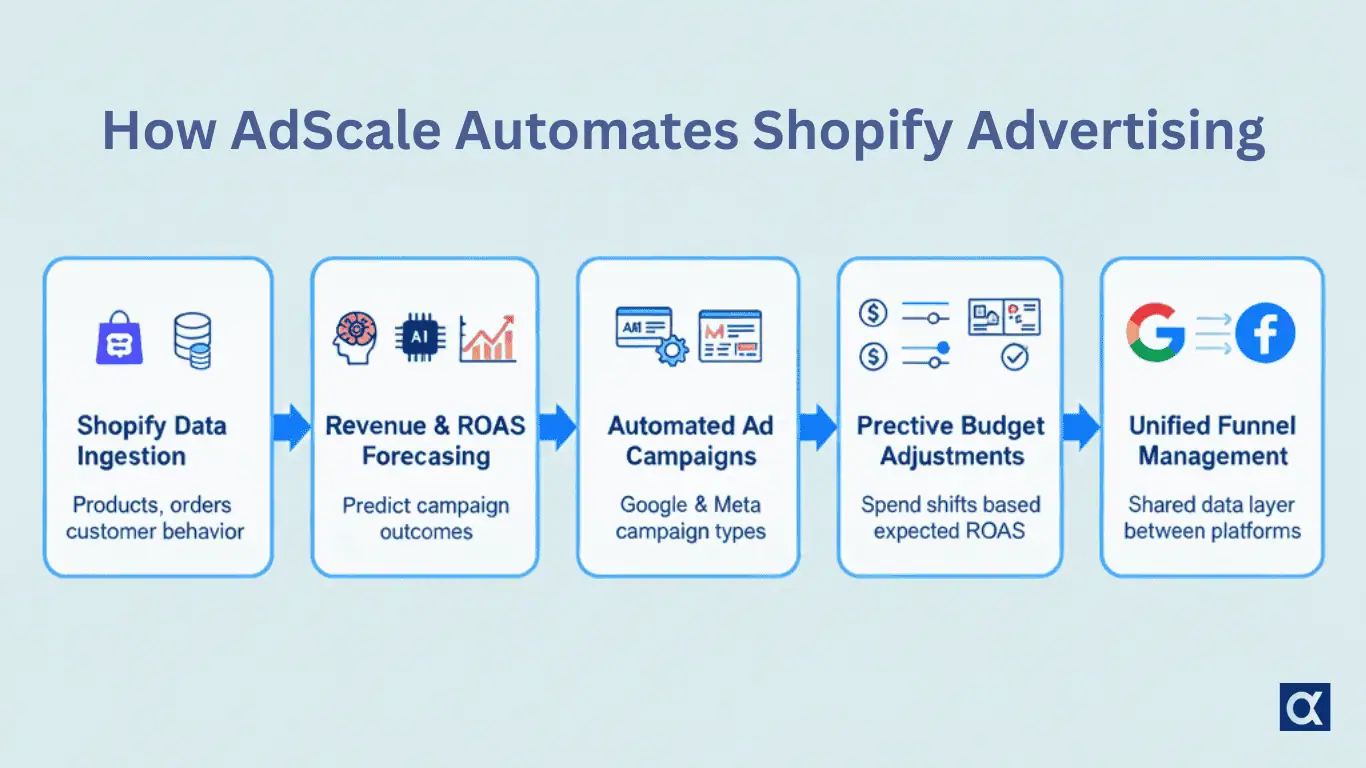
AdScale provides AI driven tools that automate advertising across Google and Meta for ecommerce brands. Each feature is designed to improve performance, increase efficiency, and reduce manual workload for Shopify and BigCommerce stores.
Overview of AdScale Features
AdScale includes predictive budget allocation, creative generation, campaign automation, audience building, scaling rules, and unified reporting. These features work together to form a complete advertising automation system.
Predictive Budget Allocation
AdScale predicts revenue, conversions, and ROAS for each campaign and uses these predictions to control spend.
Revenue Prediction
Models calculate expected revenue by analyzing store data, product performance, and historical ads data.
Cross Channel Budget Shifting
Budgets move between Google and Meta based on which channel is expected to produce the best return.
ROAS Based Scaling
Budgets increase when expected ROAS rises and decrease when predictions show lower returns.
AI Creative Generation
AdScale automates the creation and testing of ad creatives.
Automated Variations
The platform generates image and video variants using product data and templates.
Copy Creation
AdScale produces multiple text versions for testing across placements.
Creative Testing
Variations are tested automatically and high performing creatives are selected.
Google Ads Automation
AdScale manages the main Google Ads campaign types used by ecommerce brands.
Performance Max Automation
The system builds and optimizes PMax campaigns using predictive inputs.
Shopping Campaigns
AdScale generates Shopping structures and updates feeds through Shopify and BigCommerce.
Dynamic Remarketing
Product level remarketing ads are created and refreshed automatically.
Search Campaign Support
Search keywords and match types are updated based on performance trends.
Meta Ads Automation
AdScale automates Meta campaigns with AI driven optimization.
Prospecting Campaigns
The system tests new audiences and creatives to find scalable groups.
Retargeting Campaigns
Visitors are segmented based on store behavior and targeted with personalized ads.
Creative Rotation
Underperforming creatives are replaced with better variants.
Audience Testing
New audience combinations are tested continuously.
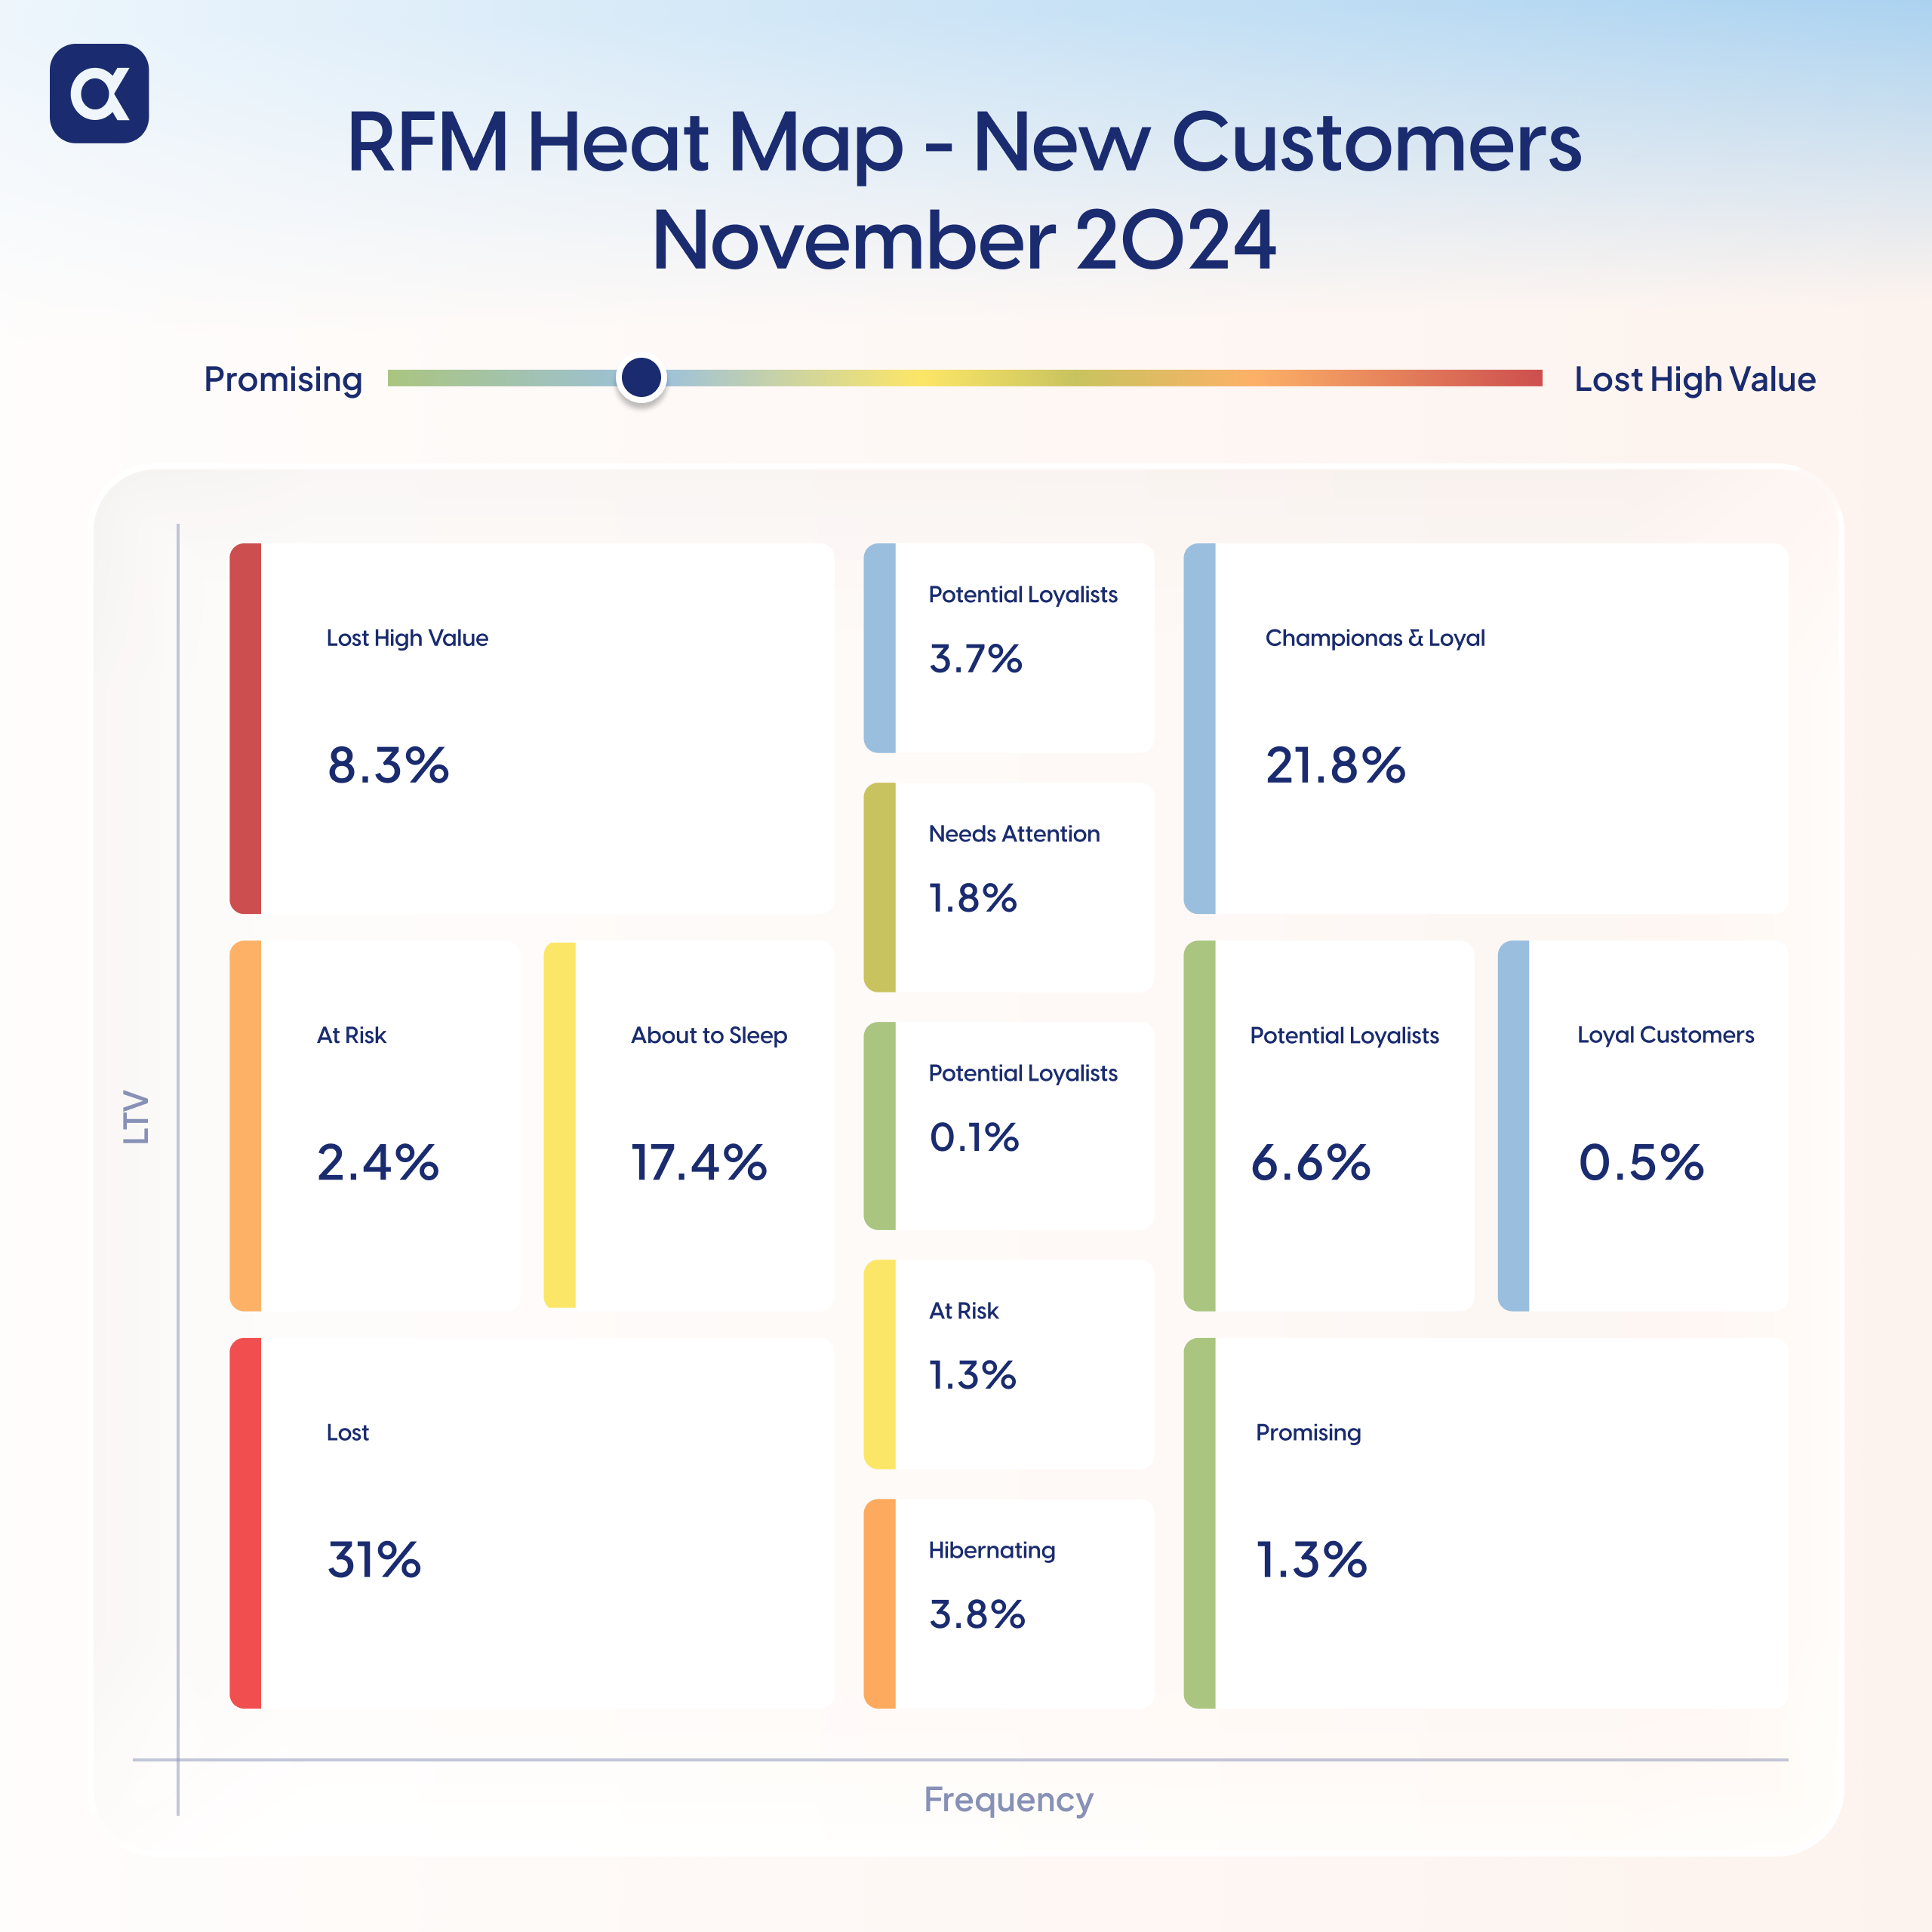
Smart Audience Builder
AdScale uses store data to form high quality audiences.
Store Data Segmentation
Audiences are grouped by purchase behavior, cart behavior, or browsing patterns.
Behavioral Audiences
The system builds audiences based on actions such as add to cart, view content, and search behavior.
Lifecycle Audiences
Segments based on returning customers, high value customers, and first time buyers.
Automated Scaling Rules
Scaling is handled automatically to match predicted performance.
Budget Increases
Budgets rise when the system expects positive results.
Budget Reductions
Spend is reduced when predictions show slower performance.
Predictive Triggers
Scaling decisions are based on forecasts, not only recent historical data.
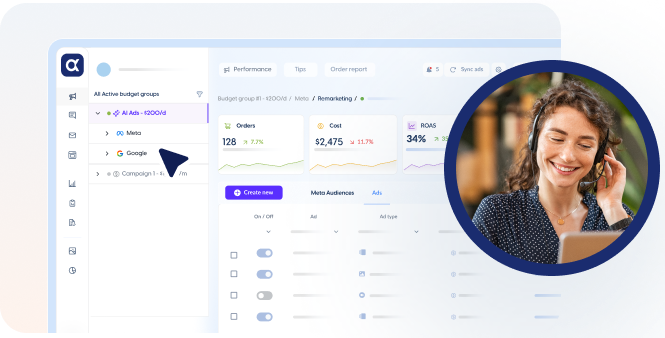
Unified Reporting Dashboard
AdScale combines Google and Meta metrics into one reporting system.
Combined Channel Reporting
Results from Google and Meta appear in one dashboard.
Funnel Visibility
Users see brand awareness, prospecting, retargeting, and purchase stage metrics.Product Level Reporting
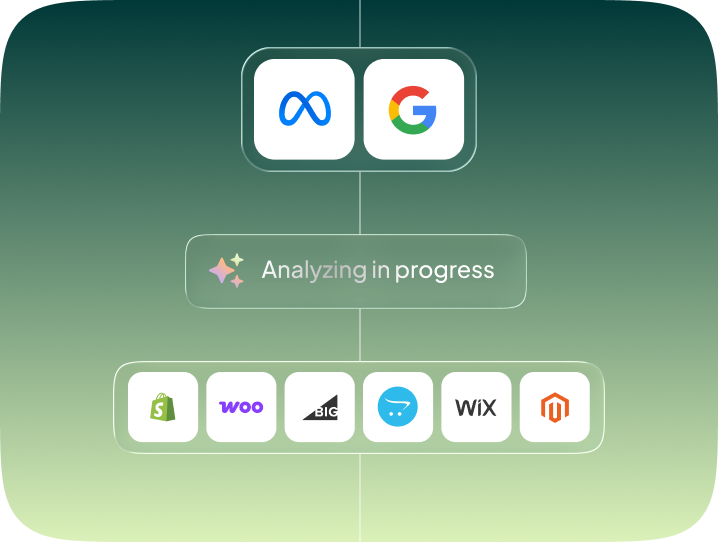
Integrations
AdScale connects to core ecommerce and ad platforms.
- Shopify
- BigCommerce
- Google Ads API
- Meta Marketing API
Summary
AdScale includes predictive budget allocation, creative automation, campaign generation, scaling tools, and unified reporting. These features allow ecommerce brands to run Google and Meta ads through one automated AI system.
FAQ Section
AdScale includes predictive budget allocation, creative generation, campaign automation, audience building, scaling rules, and unified reporting.
Yes. AdScale automates Performance Max, Shopping, Search, and dynamic remarketing campaigns.
Yes. AdScale creates, tests, and optimizes Meta prospecting and retargeting campaigns.
Yes. The platform generates and tests creative variations for images, videos, and copy.
Yes. The system moves spend between channels based on predictive performance.


 Shopify
  WooCommerce
  Magento
  BigCommerce
  Opencart
  Wix
Wix 


 ,
,